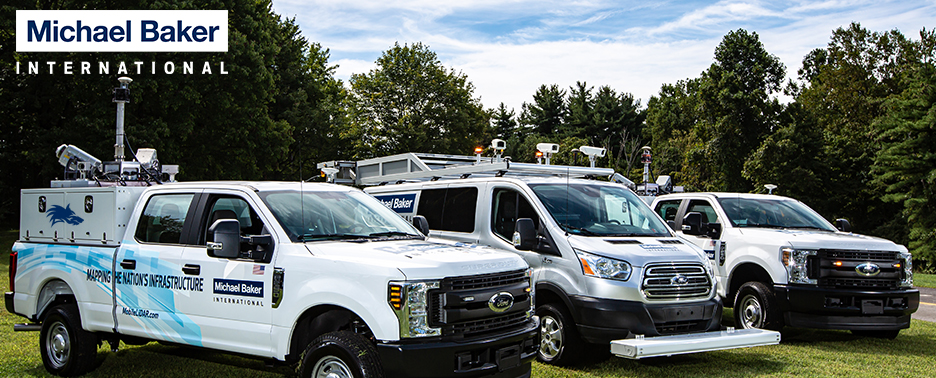
Lately we’ve been considering our Mobile LiDAR Data
activities under a different light so to speak. In a word, LiDAR. We get to see
our world quite differently through the vast amounts of LiDAR and
imagery we
collect performing very large urban projects. I was recently at the DistribuTECH
2018 conference to better understand how utilities with electric and/or
broadband services are considering and reacting to technological, economic and
societal implications of a Smart City.
Development of a Smart City affects nearly all systems
comprising a City’s infrastructure. An electric grid’s smart meter system and
grid improvements are fully functional with 5G capabilities. Fiber and wireless
networks are implemented to carry present and future data from many
connected-systems. Smart technology enables real-time diagnostics and management
of: utilities; aviation, automotive, commuter rail and other vessels or vehicles
comprising intelligent transportation systems; and government facilities and
services, health services and activities, and first responder functions. Entertainment
and recreation services, domicile and commercial facilities, and
consumer-driven information demands are all connected. Web-browsing, texts, voice, machine data, automatous
things, and pictures or video are transmitted at speeds of 1Gbps to 10Gbps or
more with 5G.
Many Smart City displays were at DistribuTECH 2018. The
photo of an AT&T kiosk shows a 3D city-street model with conceptual graphic
trajectories of many smart devices communicating wirelessly to their antennas.
This sort of 3D analysis is necessary for wireless propagation modeling for placing
microcell and small antennas. Mobile LiDAR is a perfect solution for data
needed in 3D modeling and analysis, and for preparation of design, construction
and permitting data.
Michael Baker extracts many forms of utility and roadway network
details from our LiDAR point clouds and exports data directly into utility pole
analysis, as well as various CAD, GIS and Asset Management applications. We
also collect and model aerial electrical distribution and meter services. We measure
anything attached to the pole or visible on the ground like road and sidewalk
conditions, curbs and gutters, signage or pavement markings, or other visible
utilities in the right-of-way. This data is used in planning and designing the many
networks to serve a community.
 |
| Stopping to overlook our Bay Area collection. |
Michael Baker’s Mobile LiDAR vehicles have recently
collected over 7,000 miles of roadway corridor covering nearly 3.5 Million
metropolitan residents in the largest cities across the United States. Terrestrial-mobile
LiDAR and spherical imagery is used to update maps, GIS data and 3D models to
understand a city’s in situ conditions to support design and construction
permitting. However, the same data can be used for a multitude of other
societal purposes such as the implementation of complete streets, local transit
planning, ADA compliance or similar programs.
Ultimately the collected LiDAR data helps serve a community with
improved utility networks and other infrastructure. By using LiDAR, cities are
creating better, safer, healthier communities in which to live and work. Better
planning, design and construction is a great outcome. It’s smart, too.
Cheers!
Bob


