Thursday, June 30, 2016

Back in the Saddle

It’s not very common that I, or the rest of the LiDAR Center’s management team for that matter, get the opportunity to physically sit in the driver’s seat and be part of the daily logistics train. But as luck would have it, on two such occasions over the past year I’ve had the opportunity to road trip with a Mobile LiDAR system.

Operating 4 Mobile LiDAR units (see Launching a Fleet) gives us the ability to be in many more places than ever before, but that’s only possible if there are LiDAR technicians available to transition the units from project to project. Even the most dedicated staff need a couple days off between long deployments; so needless to say, these trips were born out of necessity.

It’s been a little over 8 years since I’ve had the opportunity to do any field work, but it didn’t take long to get right back into the swing of things. Logistical efficiency is the name of the game. The more efficiently we perform on the work site and move between projects, the more projects we complete each deployment cycle, and the more cost savings we pass along to our clients. Think of it as “Just in Time” surveying.

Often overlooked and frequently taken for granted are the intricacies associated with the transition of field equipment/personnel between projects. The majority of people give no more consideration to a mobilization event than the time it takes to briefly consider the 1-2 day line-item on a project’s Gantt chart. In reality it’s a well-choreographed ballet of driver swaps, pit-stops, bio-breaks, traffic avoidance, and ad-hoc photo-ops.

Mobilizations are all about time-management. More aptly, it’s all about minimizing the loss of time. Speed limits and known construction sites establish the baseline for maneuvering from A-to-B. Accidents, thunderstorms, low overhead clearances, impromptu parades, flat tires, ice fog, volcanic events, presidential motorcades, and the occasional late night burrito lurk beyond every bend in the road looking for the opportunity to delay your arrival (and yes, I’ve encountered all of these, and many more in my day).

Don’t fool yourself into thinking that the drivers’ job is just a mindless exercise of maintaining 10-and-2 on the wheel and keeping it between the lines. Every delay, regardless of severity, and every spotted mile-marker evokes a seemingly-constant mental recalibration of the projected arrival time and the logistical changes that need to be coordinated.

Each and every time the vehicle stops you lengthen the amount of time you’ll be on the road that day. And with a 3-foot tall set of equipment strapped to the roof, there’s no options for the driver-thru. So each trip quickly reverts to a game of “how long can I wait”.

  • Can the radio go loud-enough to drown-out the incessant squeaking/rattling coming from the toolbox that vibrated loose? 
  • Will the fumes in the tank get me to the travel plaza at the next exit that has a deli and a Dunkin Donuts, or do I pull over now at Mr. Bob’s Country Gulp-n-Guzzle with the slowest pumps known to man? 
  • Can I make it to the in-and-out convenience of the Rest Stop, and what are the chances it’s closed due to budgetary cutbacks?
My hat’s off to the unsung heroes of the road trip. It was a great refresher on how much I appreciate our amazing team of operators.

Aaron
LiDAR Services Director

Thursday, June 23, 2016

Esri International User Conference

 Come visit us at the 2016 Esri International User Conference in beautiful San Diego.  Michael Baker will be exhibiting at the IUC (Booth #2506) June 28-30.  If you can’t find our booth by number, just look for the 8’x10’ image (see below) of our all-in-one Mobile LiDAR + LCMS + GPR equipped vehicle.  Both Bob Hanson (GIT National Practice Lead) and Aaron Morris (LiDAR Services Director) from our National LiDAR Center will be in attendance, as well as numerous representatives from offices across the country, so take a moment and stop by to learn more about Mobile LiDAR or any of the other world class services we provide.  


Cheers!
Stephen

Friday, June 17, 2016

LiDAR Data and Orbit GT


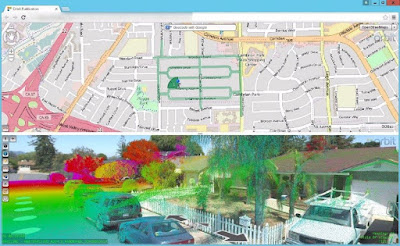
Now that you’ve got Gigabytes or Terabytes of processed Mobile LiDAR data, what do you do with it? Experienced end-users may have multiple tools to view and manipulate Mobile LiDAR data; but what about the average John Q. Public that doesn’t have tens-of-thousands of dollars to dump into software and training? To help our clients maximize their resources we’ve implemented a web-based solution on our BEAST environment (see Belly of the BEAST) that leverages the Orbit GT framework to link panoramic imagery, GIS/CAD features, and LiDAR point clouds into a single integrated solution that can be accessed from any of the most popular internet browsers.

By publishing the LiDAR data with Orbit end users are provided a user-friendly platform to view, collect, and interact with various forms of field-collected data. The configurable user environment typically contains two imbedded, user-scalable windows for an overview map (top section) and the panoramic imagery and LiDAR point cloud (bottom section). The overview map supports OpenStreetMap, which provides an excellent backdrop for the overlay of panoramic image locations and available GIS data. Similarly, GIS data can also be overlain on panoramic imagery / point cloud window(s), provided valid elevations are available in the GIS.


Other basemap functionality includes the ability to geocode addresses using Google’s geocoding engine, search by GIS object, and search by X,Y coordinates. The Search by Object tool is particularly helpful as it will search all attributes within the selected layer, not just on a single column.

The panoramic imagery / point cloud section also has a robust selection of tools through which the user can toggle on/off layers and interrogate GIS data, as well as the ability to open multiple viewing windows to simultaneously observe the same location from various perspectives. 360-degree pan/zoom functionality is standard, as are measurement tools including: positional location, distance, line (single and multi-segment), area, and volumetric calculations.

The beauty of the solution is the ease of use. Anyone that’s ever used an online map will be self-navigating and making meaningful observations within minutes – and all without any special software or any required training.

Stay tuned, I’ll share more content in the future about this and other technology being leveraged by our clients.

Regards,
Scott

Scott Peterson is a Systems Supervisor in Michael Baker's Ridgeland, MS office. His responsibilities include Database Administration for the BEAST, data maintenance and publishing for use by Michael Baker's staff and clients.

Thursday, June 9, 2016

Origin of a Point Cloud

Wikipedia has defined a “Point Cloud” as “a set of data points in some coordinate system”. In a three-
dimensional coordinate system each point is commonly defined by an X, Y, and Z value, and is often employed to represent the surface of an object. Point cloud geometry is often referred to, rather mistakenly, as LiDAR. LiDAR is a technology that can be used to make point clouds; so measurements produced with LiDAR technology is more aptly known as LiDAR data. Most commonly, point clouds are the result of data being output by 3D scanners. Aerial and Terrestrial LiDAR sensors are two such examples of 3D scanners that perform a large number of measurements on an object's surface to output a point cloud, but as you’ll read, point clouds may originate from various other sources and technologies.

Photogrammetric Detection and Ranging (PhoDAR) is an alternative technology to conventional photogrammetry and LiDAR to generate point clouds. Though, PhoDAR and LiDAR are both capable of producing point clouds, the primary difference being PhoDAR uses photographic data (i.e. pictures) collected with a camera to generate a point cloud, whereas LiDAR involves the collection of data measured directly from the reflection of an object using a laser.

Another technology from which topographical point clouds are regularly created is IFSAR (Interferometric Synthetic Aperture Radar). . IFSAR sensors are typically flown in fixed-wing aircraft or mounted to satellites, and primarily uses X-band data of the electromagnetic spectrum to perform measurements. IFSAR data collection involves placing two radar (radio detection and ranging) antennas on the vehicle such that one antenna transmits a radar beam, and then both antennae receive the radar beam reflected from the target (usually the earth’s surface). Captured signals are combined with aircraft telemetry and positional data are processed to generate an interferogram, which is employed to generate elevation products.

Sound Navigation and Ranging (SONAR) technology uses the propagation of sound in an underwater environment to target objects. It is most commonly used to in the surveying profession to determine water depth (bathymetry). Sonar is applied to water-based activities because sound waves attenuate (taper off) less in water as they travel than do radar and light waves.

In future posts I’ll provide detailed analysis of the pros/cons, uses, and accuracies of the various technologies, but for now, the following table provides a brief overview of each.

Technology
Coverage
Accuracy
Use of Technology
Terrestrial LiDAR (Mobile or Static)
Small-to-Medium area projects
1cm
Buildings, Corridor mapping, Asset Inventory, Engineering Design
Aerial LiDAR
Large area
projects, in varied terrain conditions
10 cm
Flood plain mapping, Disaster Management, Transportation and Engineering design, Impervious surface mapping, vegetation mapping
PhoDAR
Medium-area projects
15+ cm (dependent on GSD)
Same as above
IFSAR
Large area projects in varied terrain conditions
30 cm
Same as above
SONAR
Small-to-Medium area projects
5-10cm
Underwater studies, dredging, navigation

Cheers!
Srini

Friday, June 3, 2016

Belly of the BEAST

A bank of 2 TB hard drives in our Data Center.
In an effort to better support processing and managing “Big Data,” Michael Baker implemented the Baker Enterprise Architecture for Spatial Technology (BEAST) platform. The BEAST is a fully integrated enterprise solution that allows for server-side and cloud-based processing, production, storage, and hosting within a single framework.

The BEAST hosts a variety of tools that are available to all Michael Baker offices and enables our staff to collaborate on projects in an effective and efficient environment across offices, regions and even continents.

Michael Baker employees typically access the BEAST via Citrix MetaFrame interface. This allows users to access the data through a thin client with all data and software residing “in our private cloud”.

Software and database solutions that we use for LiDAR processing and feature extraction or GIS product production include Optech’s LiDAR Mapping Suite (LMS), ArcGIS (in multiple flavors), Orbit GT, SQL Server, FME, MicroStation, GeoCue, TopoDOT and LizardTech GeoExpress along with custom developed applications. By utilizing fully virtualized environments, the BEAST allows for unparalleled flexibility to rapidly scale additional resources for large-scale project delivery. In many cases, we will also utilize Amazon and Microsoft Cloud services for surge needs; while we continually evaluate overall cost effectiveness of those and other cloud platforms considering the practicalities of uploading and storing terabytes of LiDAR data each day to a cloud service.

Two 56 TB storage servers at a local production office.
In our last posting, Aaron briefly questioned how you would manage 4 terabytes of new data on a daily basis. One of our solutions is the management of data and core processing functions at the BEAST. Where more robust processing is required and a thin client simply will not do, we push data to offices for further processing. Our regionally based processing centers have robust LiDAR server solutions with 50 – 200 Terabytes of storage each. Due to increase network traffic to support the rotund datasets, we have deployed Cisco Meraki network infrastructure for Multi-gigabit connectivity.

Cheers!
Art

Art Morris is a Systems Analyst in Michael Baker's Harrisburg office.  Art joins the Mobile LiDAR team from IT Services, to focus his talents on the acquisition, transfer, and processing of the vast amount of LiDAR data collected by our vehicles.

Art's IT background helps him to act as a liaison between departments, offices and regions, to ensure synergistic collaboration between the Mobile LiDAR team and Michael Baker's IT organization.